The Data Says This Natural Gas Company Could Be an Upside Surprise
The price charts for natural gas company CNX paint a bullish picture with a trend that suggests surprise upside over the next two years.
You've reached your free article limit
You've read 0 of 1 free Pro articles.
CNX Resources Corporation CNX is a natural gas company based in Pittsburgh with operations in the Appalachian Basin. The charts are in a bullish alignment along with the indicators and this name could surprise on the upside over the next two years.
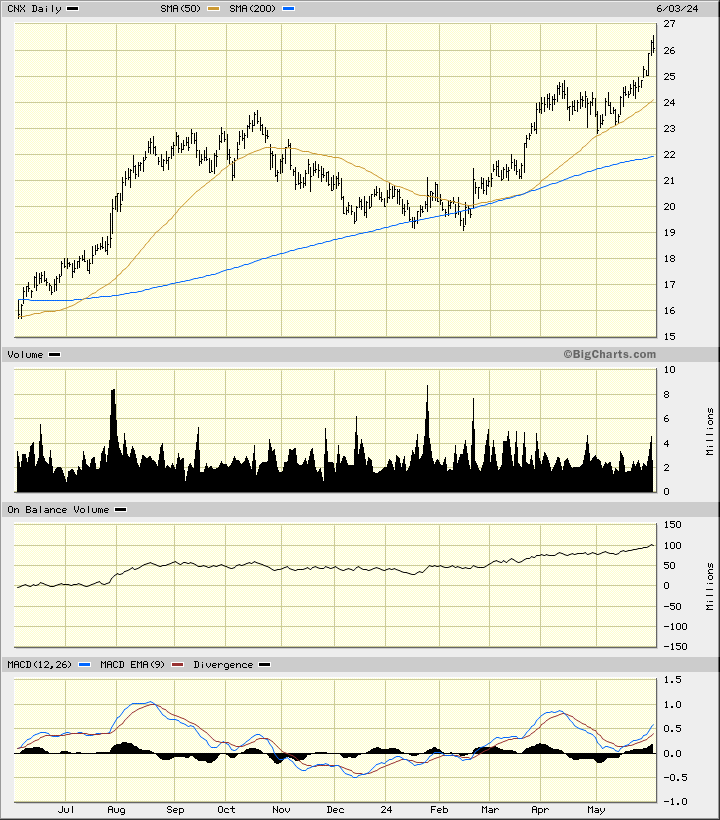
In this daily bar chart of CNX below, I see a bullish picture. Prices trade above the rising 50-day moving average line and above the rising 200-day moving average line. Trading volume was more active in January and February when prices tested the rising 200-day line. The On-Balance-Volume (OBV) line has been moving upward since January. The Moving Average Convergence Divergence (MACD) oscillator is in a bullish alignment above the zero line.
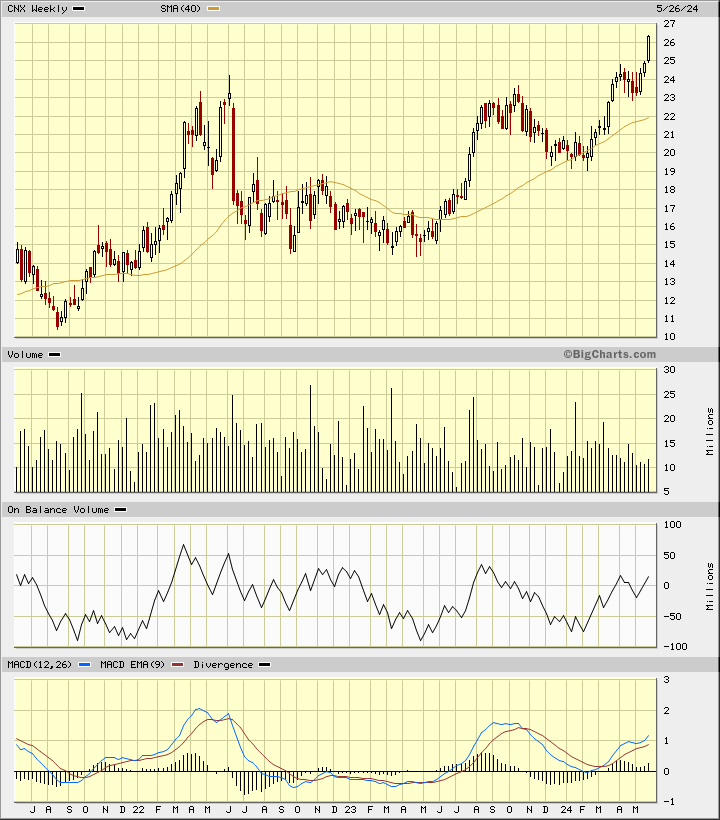
In this weekly Japanese candlestick chart of CNX below, I can see a bullish trend over the past three years. Prices trade above the rising 40-week moving average line. The weekly OBV line has been moving up and down with the price action. The MACD oscillator has not kept up with the price action but it is moving in the right direction.
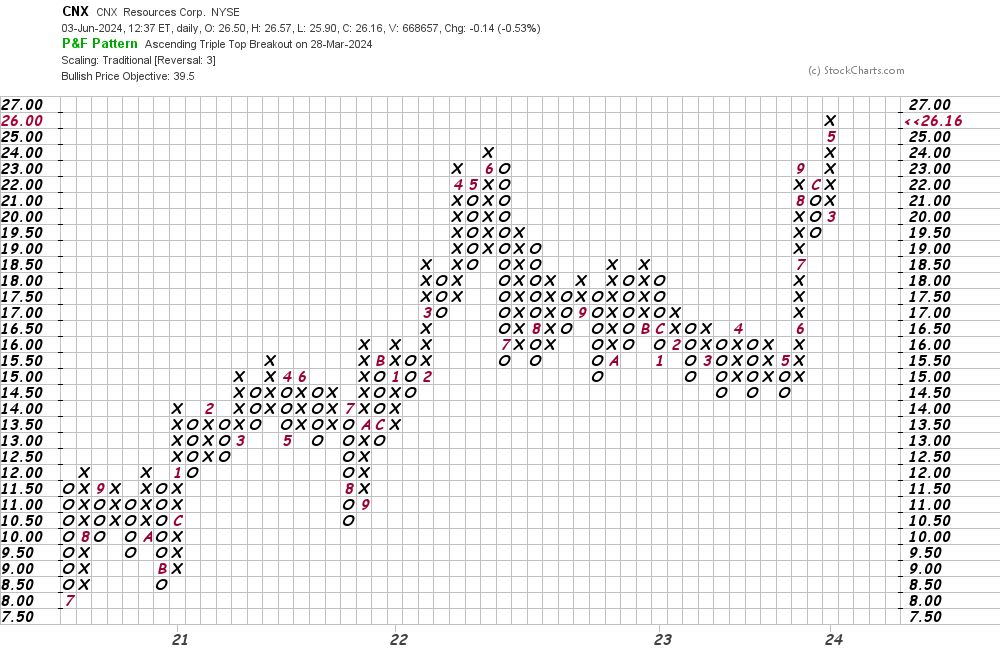
In this daily Point and Figure chart for CNX below, I can see a potential upside price target in the $40 area.
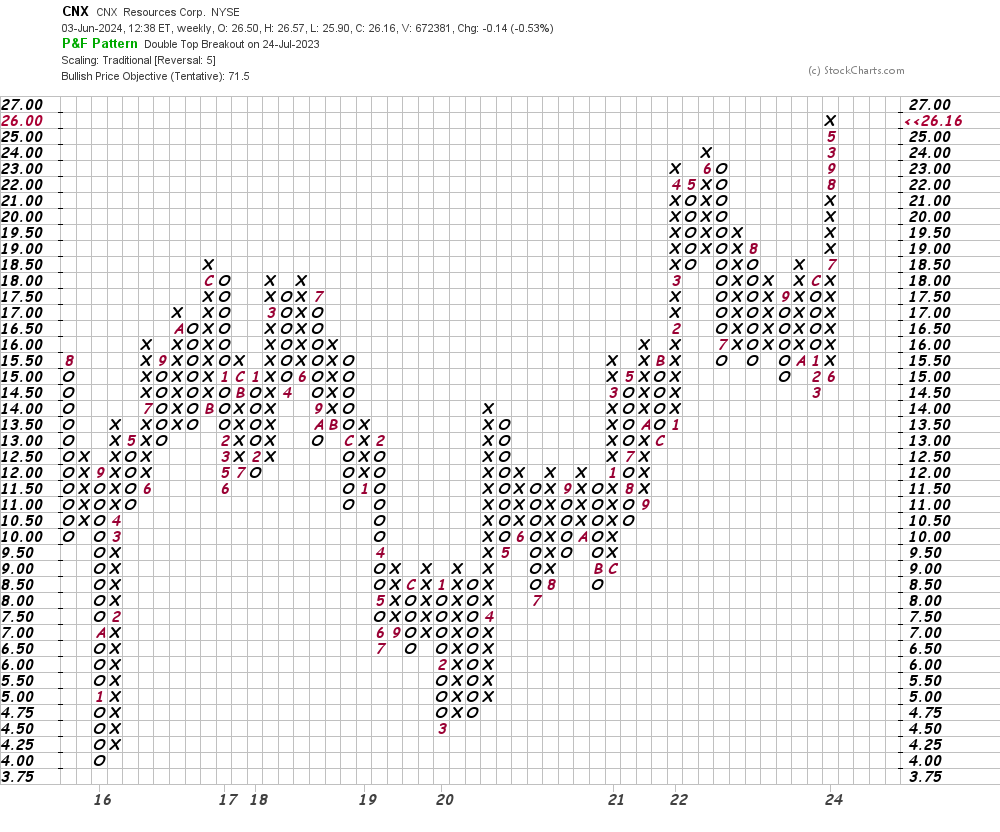
In this second Point and Figure chart of CNX, below, I used weekly price data with a five-box reversal filter. Here, the software suggests a price target in the $72 area.
Bottom line strategy: I have a positive view on the charts and indicators of CNX and I think natural gas prices are more likely to go up from here. Traders could go long CNX at current levels, risking to $21. The $72 area is my longer-term price target.
Employees of TheStreet are prohibited from trading individual securities.