Lennar Misses the Nail
The homebuilder declines as guidance disappoints, and the charts look shaky at this key number.
You've reached your free article limit
You've read 0 of 1 free Pro articles.
Lennar LEN reported third-quarter earnings that topped consensus expectations as incentives supported sales, but the stock has sold off Tuesday on disappointing guidance on new orders.
Let's check out the charts.
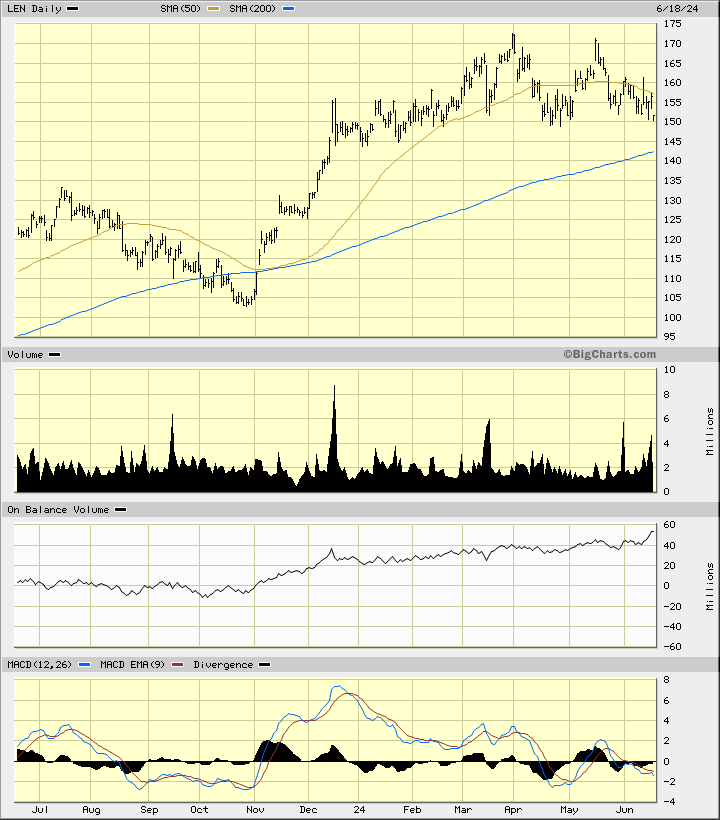
In this daily bar chart of LEN, below, I can see that prices have "rolled over" the past four or five months. LEN has weakened and now trades below the declining 50-day moving average line. The 200-day moving average line is still rising and intersects around $142, which is not far below the market. Trading volume shows an increase on the recent decline but the On-Balance-Volume (OBV) line has strengthened. I would have expected the OBV line to weaken. The trend-following Moving Average Convergence Divergence (MACD) oscillator is below the zero-line.
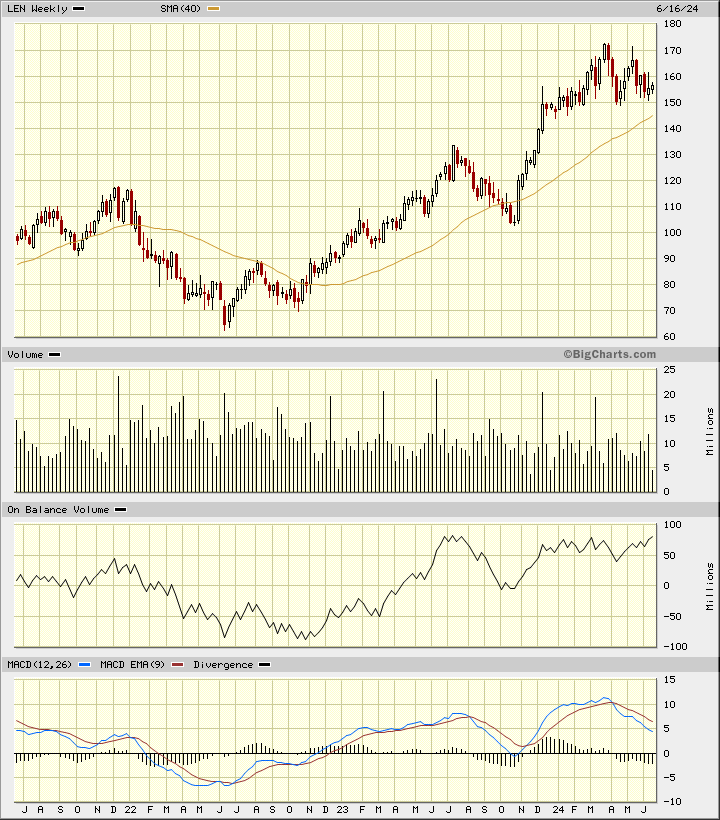
In this weekly Japanese candlestick chart of LEN, below, I can see that prices are in a longer-term uptrend. LEN has been finding chart support (buying interest) in the $150 area. A weekly close below $150 could precipitate further declines. The weekly OBV line has been strong the past two years. The MACD oscillator is in a decline and signals that traders should take profits.
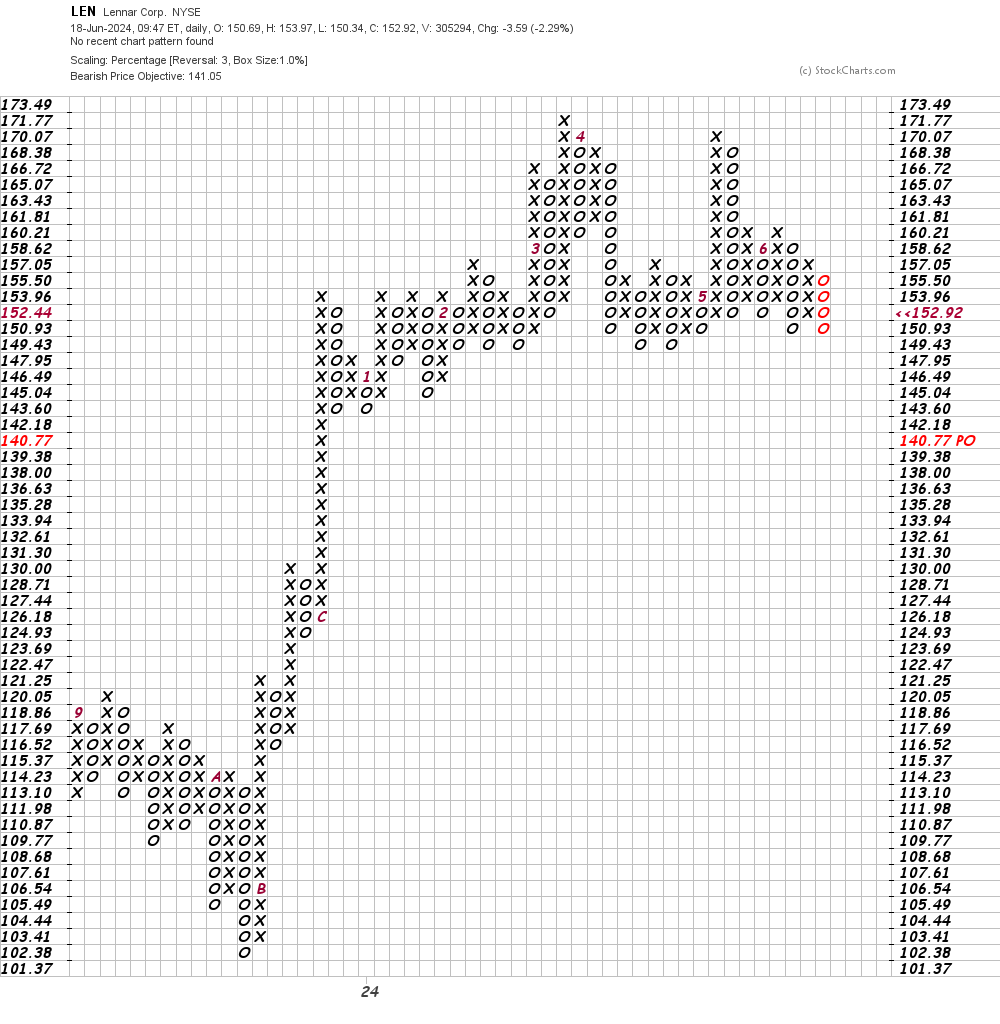
In this daily Point and Figure chart of LEN, below, I can see a potential downside price target in the $141 area.
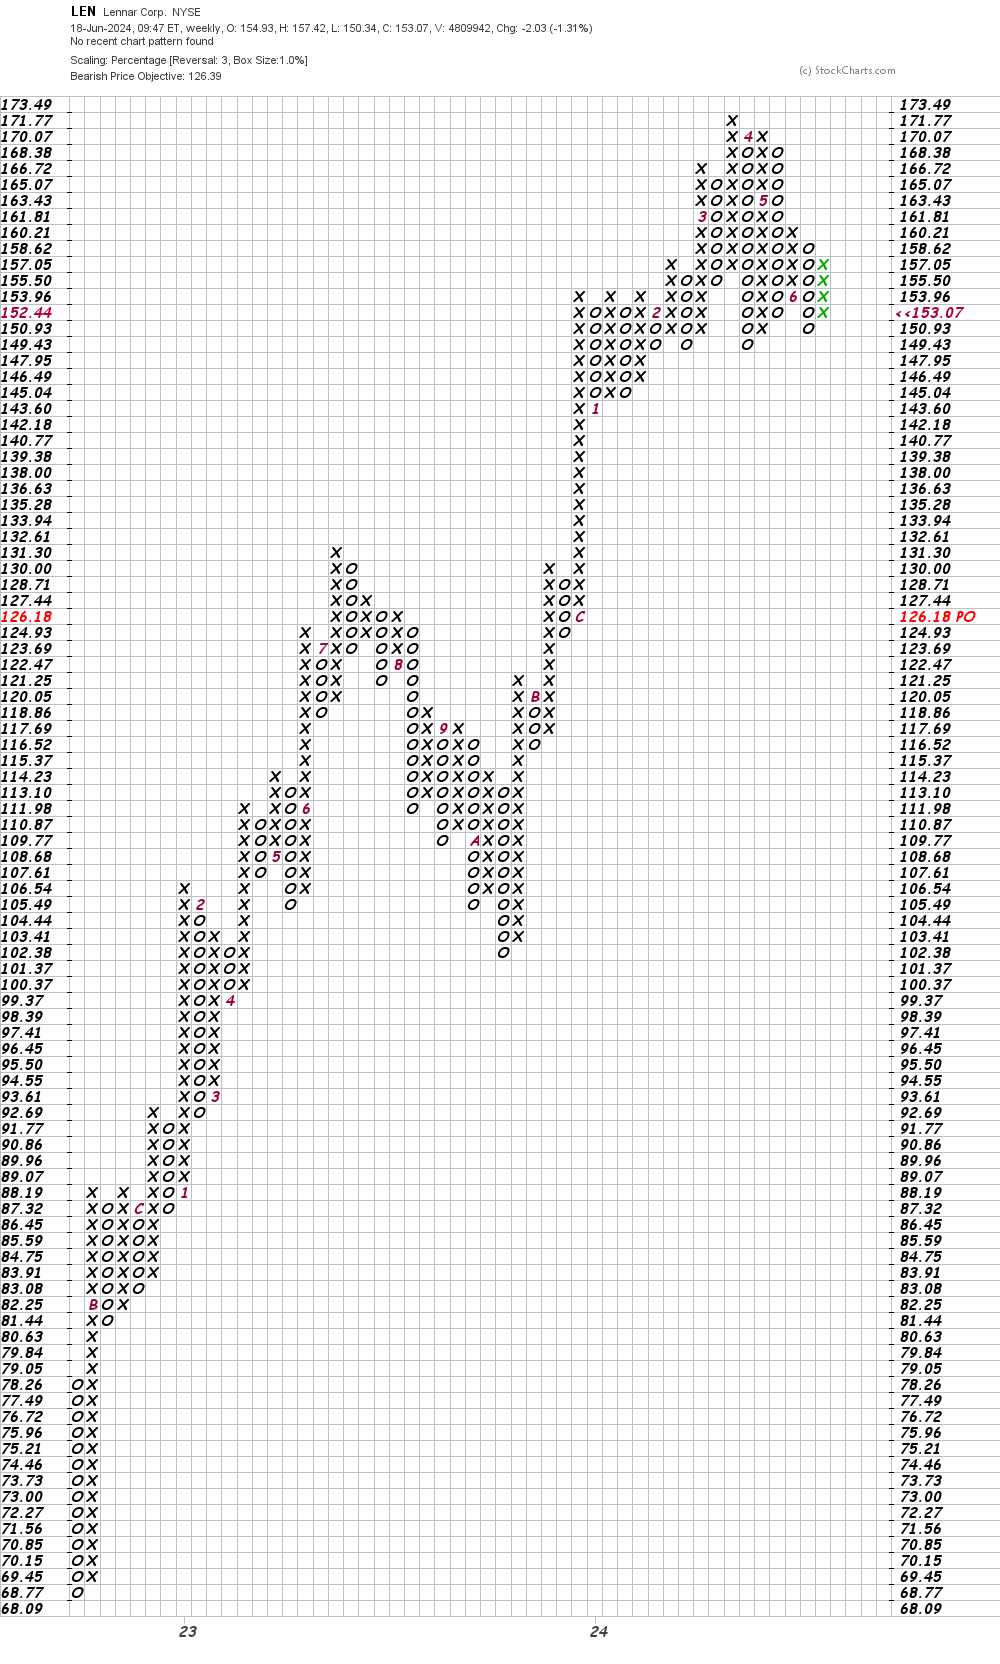
In this weekly Point and Figure chart of LEN, below, I can see a price target in the $126 area.
Bottom line strategy: The charts of LEN are weak and a slip below $150 is likely to precipitate further declines. LEN has seven developments near me in Delaware. I will have to take a drive to check out their progress.
Employees of The Street are prohibited from trading individual securities.