MicroStrategy, Bitcoin and My Critical Thinking
We need to remember that events and not people control the future, and this applies to more than just bitcoin.
You've reached your free article limit
You've read 0 of 1 free Pro articles.
MicroStrategy MSTR was up about 10% in morning trading Monday. Michael Saylor is the executive chairman and co-founder of MicroStrategy. He was on CNBC this morning telling us that bitcoin was digital property and it would go higher and that "issues" that detractors had about bitcoin were actually positives.
I am sure that believers and buyers of bitcoin were cheering him on from home, but for me I was rolling my eyes.
I was reminded of the analysis and thinking in Martin Pring's book on Investment Psychology Explained that "we gain greater confidence about a stock's rally as prices move up because higher prices tend to vindicate our judgement. We are influenced by what is taking place at the moment."
We need to remember that events and not people control the future, and this applies to more than just bitcoin.
Let's check out the chart of MSTR and bitcoin this morning.
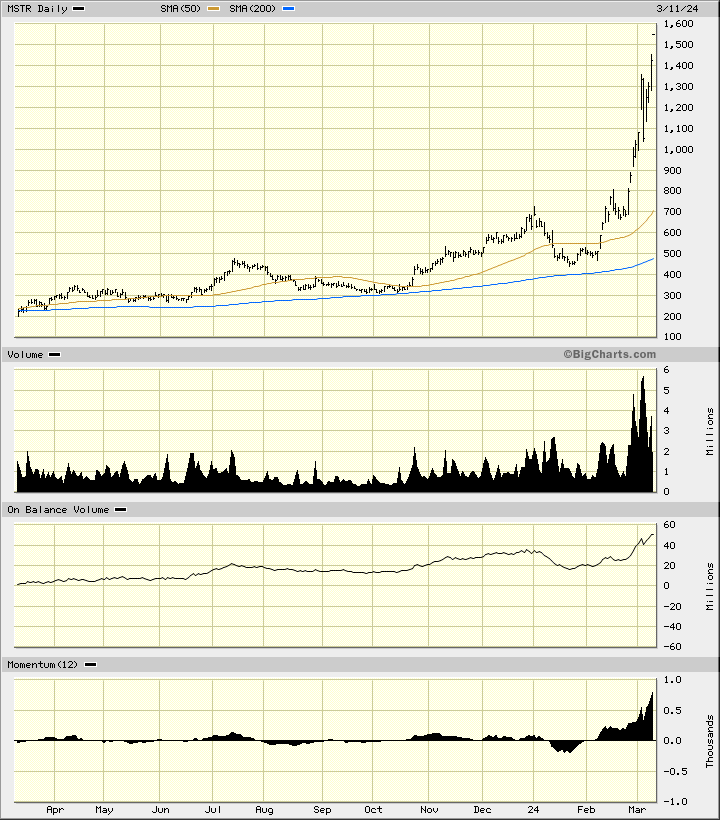
In this daily bar chart of MSTR, below, I can see that prices have soared since the middle of January. Prices have tripled in a very short period of time - very unusual in my book. MSTR trades above the rising 50-day moving average line and above the rising 200-day moving average line. Prices are grossly extended (overbought) versus the rising 200-day line which intersects below $500. Trading volume has been expanding since late October and that is bullish.
The daily On-Balance-Volume (OBV) line has mirrored the movement of the stock. The 12-day price momentum study shows rising momentum readings and no bearish divergence yet.
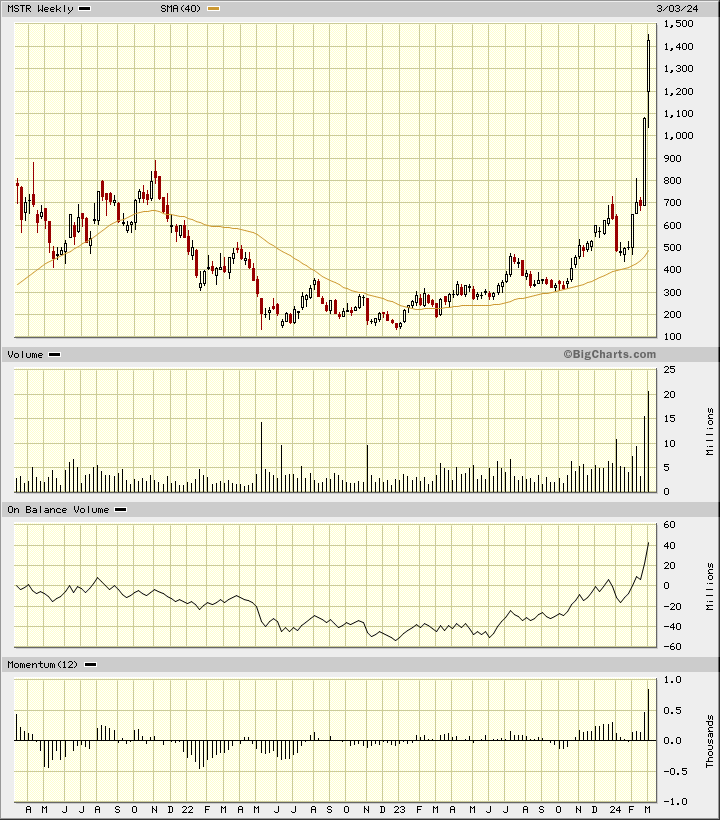
In this weekly Japanese candlestick chart of MSTR, below, I can see a small base in the $200 area in 2022. Prices trade above the rising 40-week moving average line. The weekly OBV line is very positive and price momentum has not diverged from the price action.
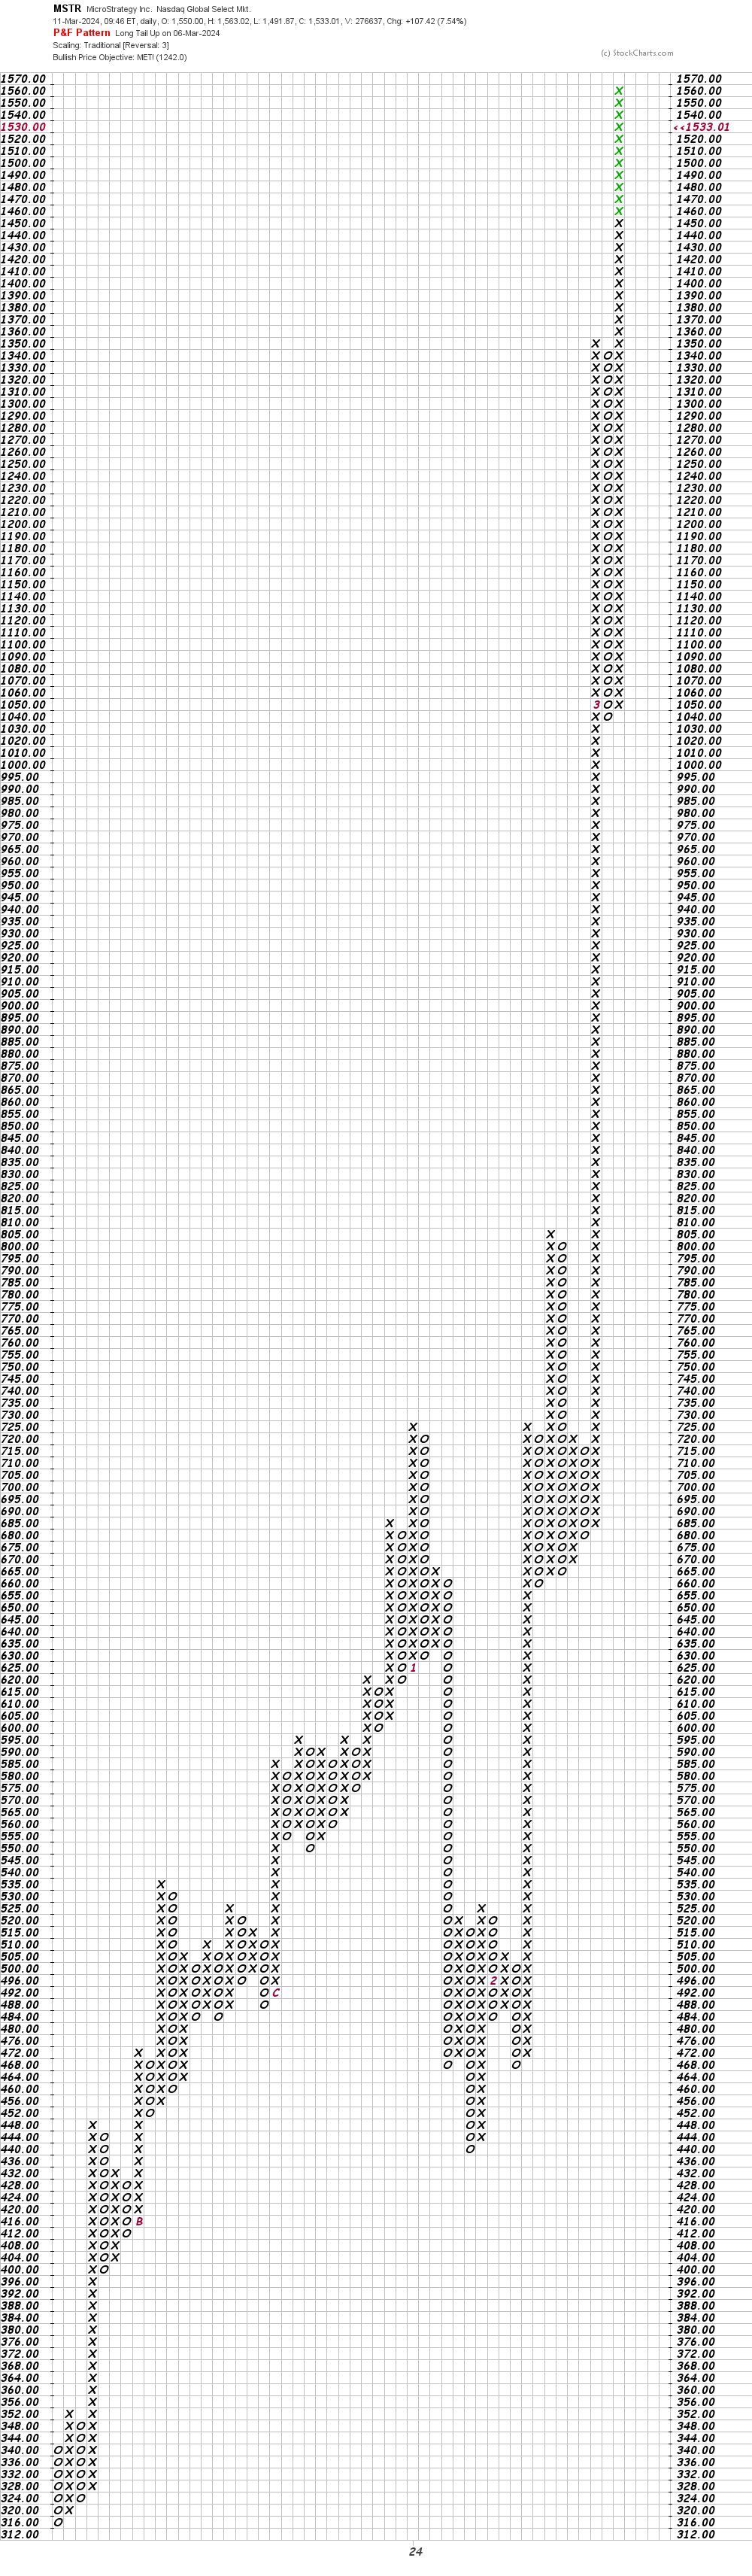
In this daily Point and Figure chart of MSTR, below, I can see that prices have reached and exceeded a price target in the $1,242 area.
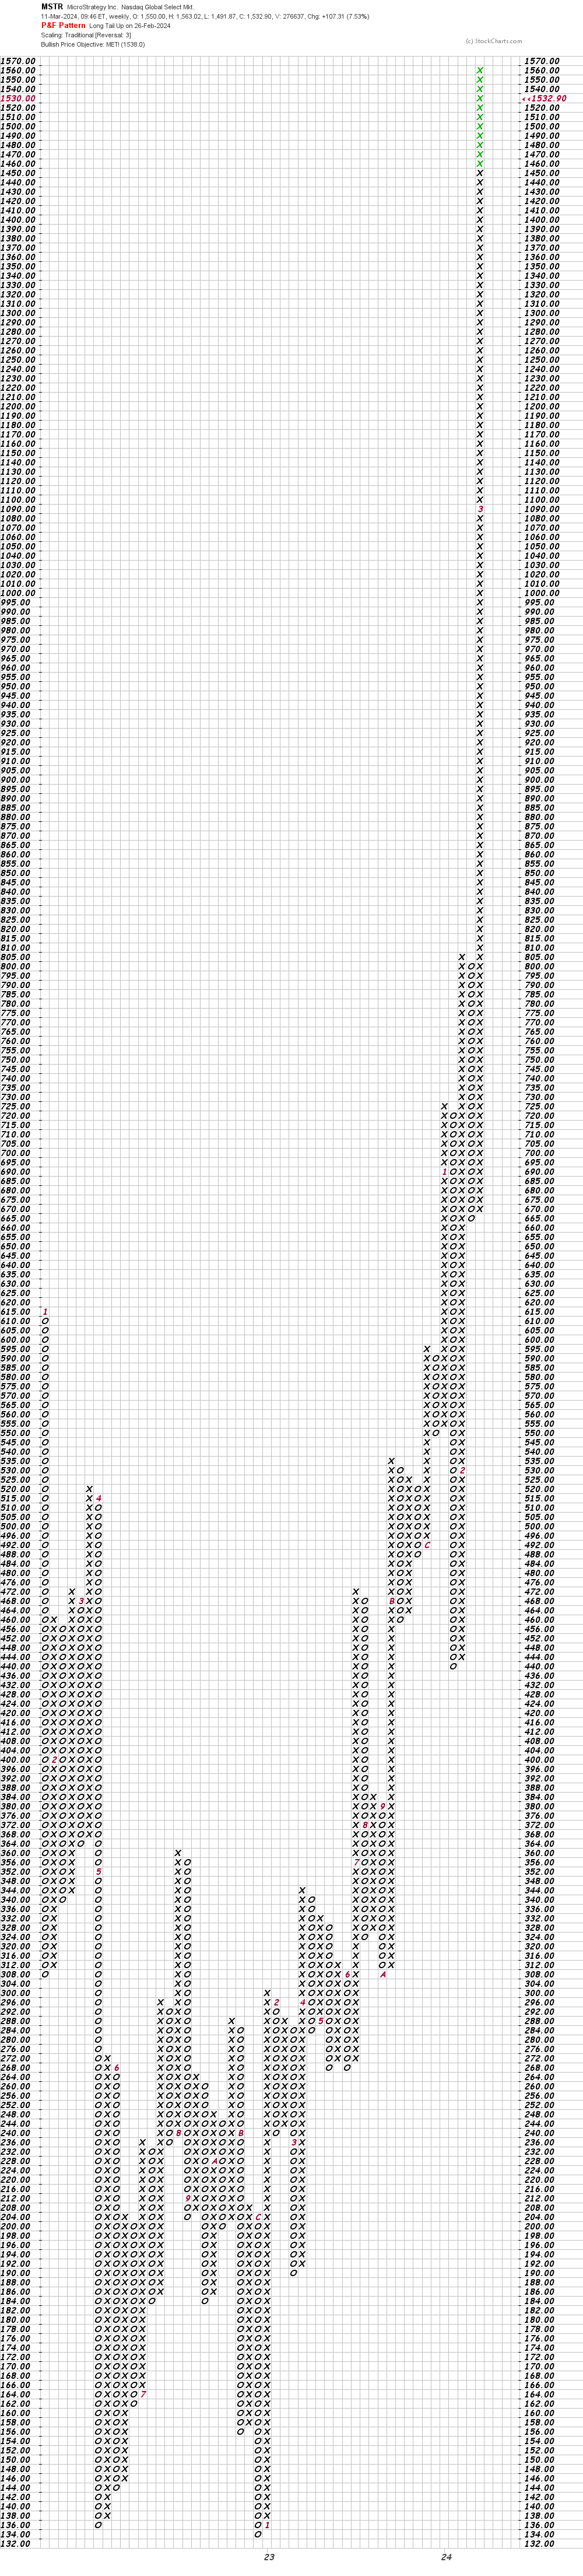
In this weekly Point and Figure chart of MSTR, below, I can see that prices have reached and exceeded a price target in the $1,538 area.
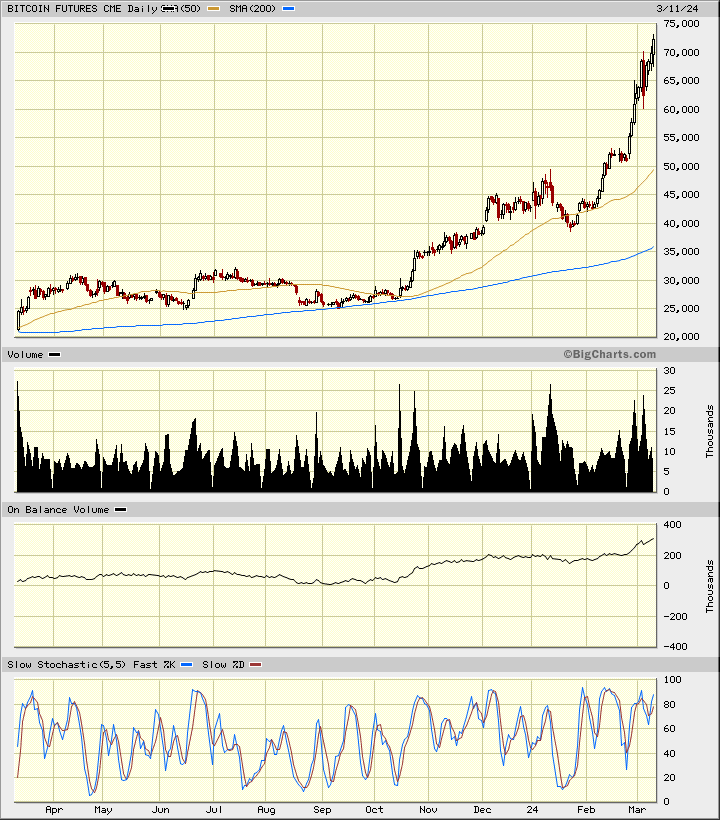
In this candlestick chart of the nearby bitcoin future's contract, below, I can see a pattern of choppy volume. A pattern of expanding volume would give me more confidence. The slopes of the 50-day and 200-day moving average lines are positive but notice that the price of bitcoin is twice the level of the 200-day line. This tells me that bitcoin is extended (overbought) and likely to correct.
The OBV line shows gains from October but it probably should be moving vertical. The slow stochastic indicator is showing me a "triple divergence" and a rare sell signal.
In this weekly Japanese candlestick chart of bitcoin futures, below, I can see the rise from $15,000 in late 2022. Prices trade at twice the intersection of the 40-week moving average line so it is extended (overbought) on this time frame. The 12-week price momentum study is likely to weaken this week.
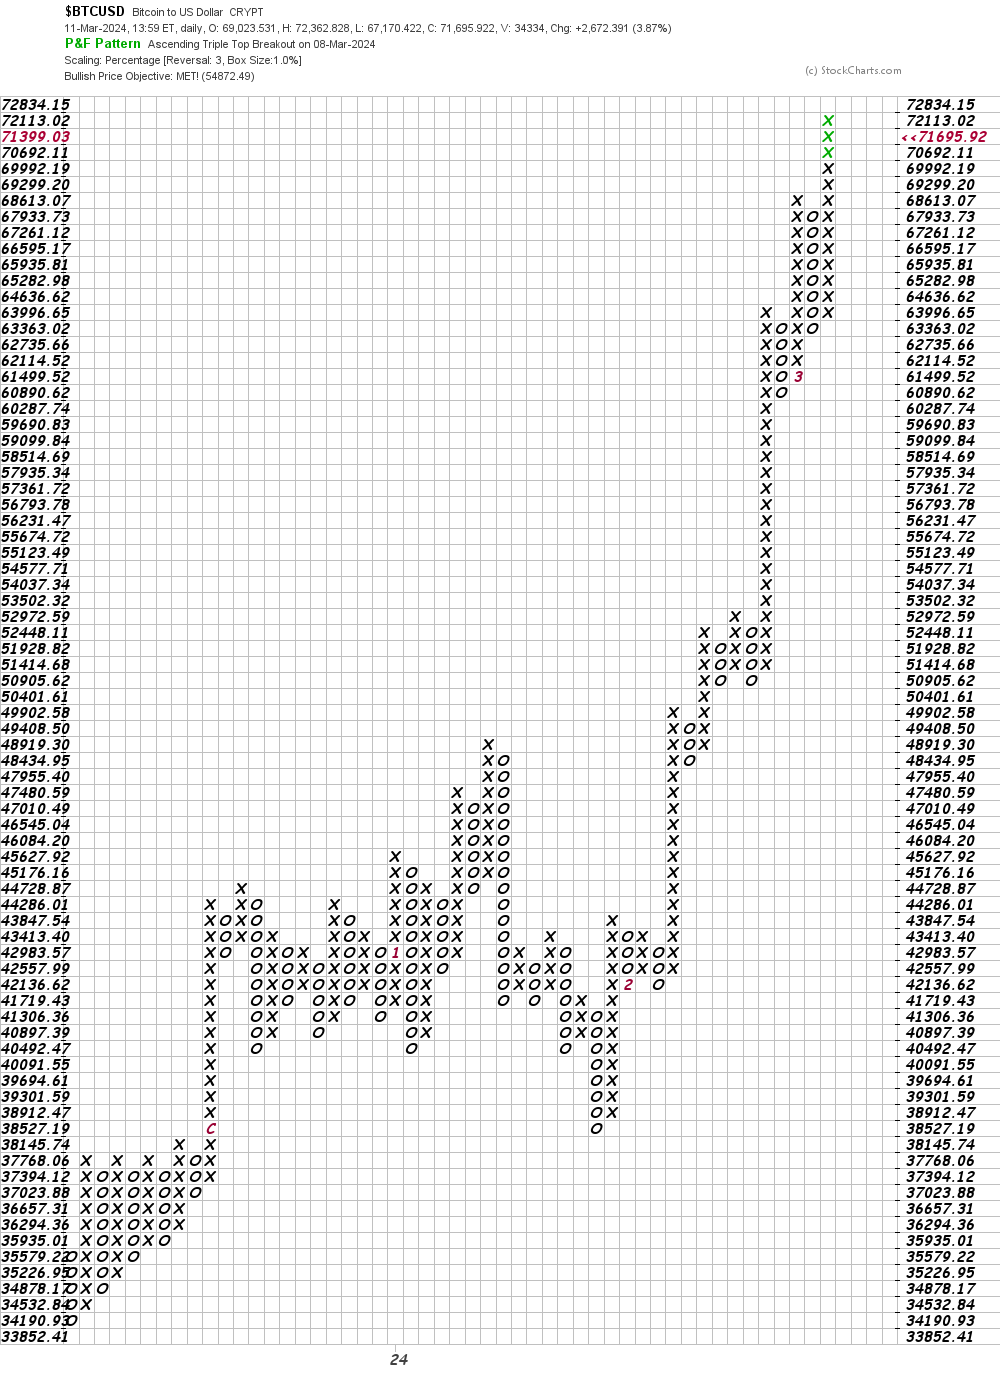
In this daily Point and Figure chart of bitcoin, below, I can see that prices have reached and exceeded a target of $54,872.
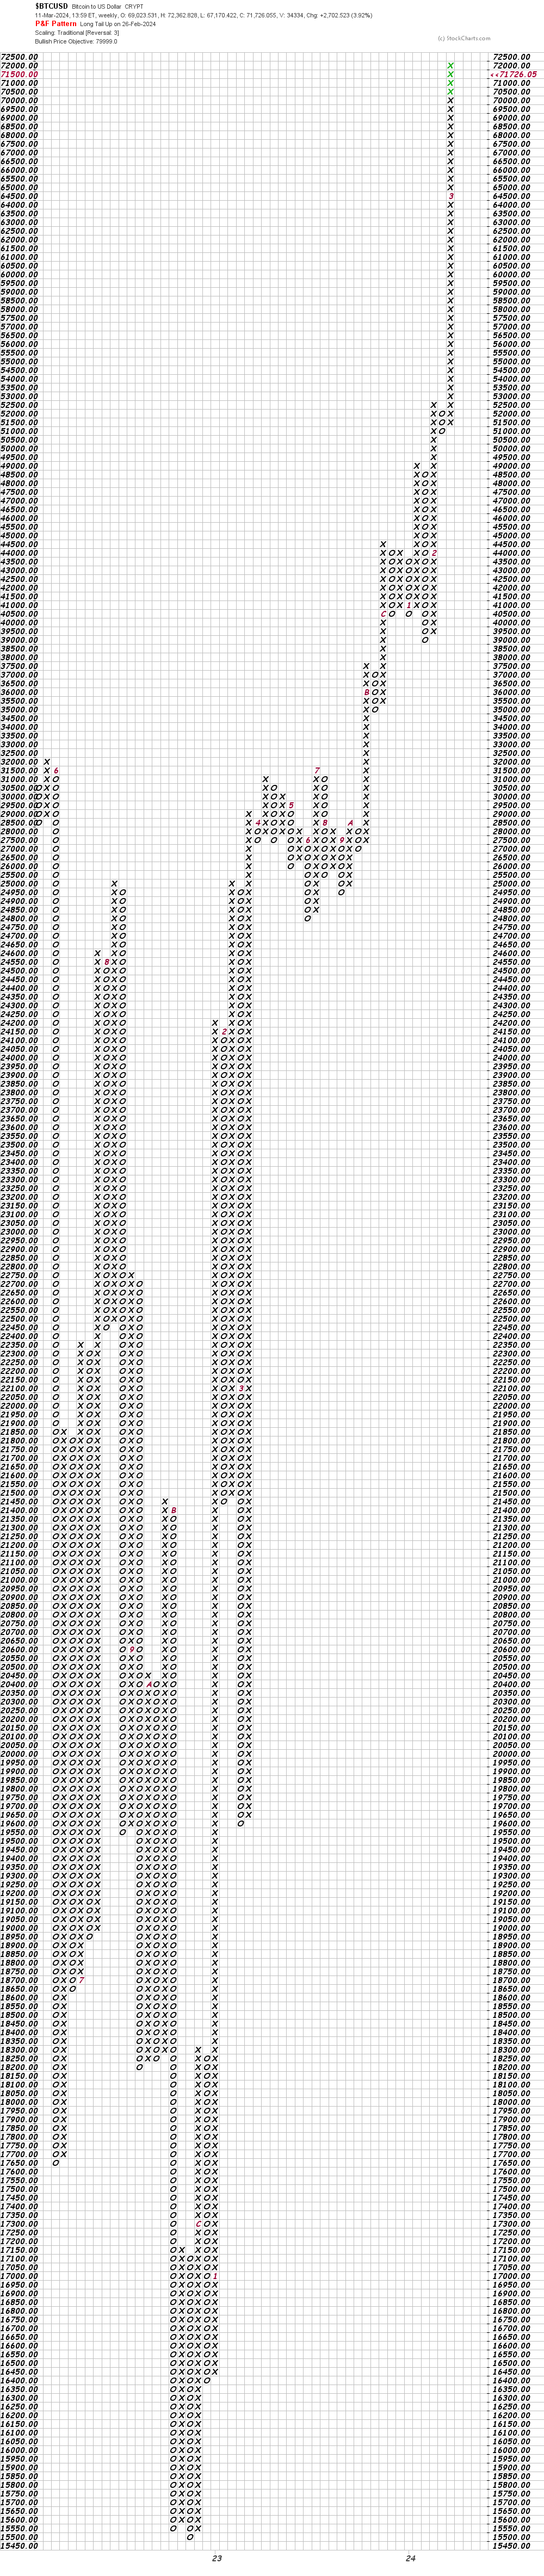
In this weekly Point and Figure chart of bitcoin, below, I can see a price target in the $79,999 area, let's call it $80,000.
Bottom line strategy: When prices are trading at twice the level of the 200-day moving average line or twice the level of the 40-week moving average line the risk is a reaction back towards those indicators. Joseph Granville made that observation back in the early the 1960's and I believe it can still be valid today. Caveat emptor.
Employees of TheStreet are prohibited from trading individual securities.